BACK TO Element Cards
Teaching Patterns, Relations, and Functions
All of the CCCs in this document relate to teaching Patterns, Relations, and Functions. Below are some additional resources that may be helpful:
NCSC Curriculum Resource Guide: Curriculum Resource Guide: Ratio and Proportions
NCSC Curriculum Resource Guide: Equations
NCSC Content Module: Ratios and Proportions Content Module
NCSC Content Module: Linear Equations Content Module
NCSC Content Module: Expressions Content Module
NCSC Content Module: Functions Content Module
Websites
http://www.mathsisfun.com/
http://www.mathplayground.com/
https://www.khanacademy.org/
http://www.mathhelp.com/
Other Resources
http://www.jstor.org/stable/10.5951/teacchilmath.19.1.0050?origin=JSTOR-pdf
http://www.ncpublicschools.org/acre/standards/common-core-tools/
CCC Mathematics | Patterns, Relations, and Functions
| CCSS: K.OA.2 Solve addition and subtraction word problems, and add and subtract within 10, e.g., by using objects or drawings to represent the problem.
|
| CCC:
|
K.PRF.1c1
|
Solve one step addition and subtraction word problems, and add and subtract within 10 using objects, drawings, pictures.
|
| Strand: Patterns, Relations, and Functions
|
Family: Representing and Modeling Problems
|
| Progress Indicator: E.PRF.1c Modeling problem solving situations that involve addition and subtraction of whole numbers using objects, diagrams, and symbols
|
| Essential Understandings
|
Concrete Understandings:
- Count up to 10 objects.
- Make a set of up to 10 objects.
- Join or separate objects and recount to get a total.
|
Representation:
- Select a numeral to place under each representation in a modeled equation.
- Select a pictorial representation of an array that matches the addition or subtraction problem.
- Know the following vocabulary: add, subtract
|
Suggested Instructional Strategies:
- Teach explicitly how to count objects in a set and that the last number said tells the number of counted objects.
- Present a set of objects for the student to count.
- Rearrange the objects and ask the student how many object there are (the student understands cardinality of numbers if s/he states the same number without recounting the objects).
- Teach explicitly how to create a group/row/set of objects for a given number or for a number provided in a simple word problem.
- Multiple Exemplar Training*
- An array/row: "This is a group/row of three apples. This is another group/row of three apples. This is another group/row of three apples. This is one apple. Show me a group/row of three apples."
- Example / Nonexample*
- Present a row of objects (≤ 10). Present a second row of objects that has a different number of objects. Ask the student to select the row with a specified number of objects.
- Present three rows of objects (≤ 10), two that are equal and one that is not equal. As the student to match the two rows that both include the same number of specified objects (e.g., a row of three hats, a row of three hats, a row of 5 shoes).
- Use System of Least Prompts to form an array (group/row) given a number:*
- "Make a row/group of three pencils." The student responds correctly. "Good work. You made a row/group of three pencils." OR The student doesn't respond. Wait 3-5 seconds and provide a gesture prompt by pointing to the pencils, OR The student doesn't respond. Wait 3 -5 seconds and provide a verbal prompt. "Pick up three pencils. Make a group of three pencils." OR The student makes an error; provide a physical prompt. Take the student's hand and give him or her three pencils and help them make a row of pencils.
- Model-Lead-Test ("Watch me make a row of four books. Let's make a row of four books. Now you try to make a row of four books.")*
- Model-Lead-Test ("Here is a story problem. It says there are seven dogs. Watch me make a set of seven dogs to match the story problem. Let's make a set of seven dogs together. Now you try to make a set of seven dogs."); repeat with the other number of object in the story problem.*
- Task Analysis: Use two rows of pictures or objects to model a one step addition and subtraction problems.
- Present a simple one step addition problem (e.g., The boys have four backpacks. The girls have two backpacks. How many backpacks to the boys and girls have?)
- Present a set of objects and a problem solving template:
- Template: ___ ___ ___ ___ + ___ ___ = ___ ___ ___ ___ ___ ___
- Show me a row of four backpacks. Put the backpacks in the equation.
- Show me a role two backpacks. Put the backpacks in the equation.
- Combine the backpacks; Fill in the equation with the total number of backpacks the boys and girls have.
- Backward chaining: Model setting up a one-step addition word problem using two arrays and ask the student to complete the last step by combining the arrays and/or counting the number of objects in the combined arrays.
- Forward chaining: Present a one step addition or subtraction word problem and ask the student to complete the first step (e.g., Show me a row of four backpacks.) Then complete the steps to solve the equation.
|
Suggested Supports and Scaffolds:
- Counters
- 2D and 3D shapes or objects, pictures
- Counters
- Number lines
- Egg cartons or muffin tins to illustrate/create arrays
- Ones blocks to form different rectangles (rows and columns)
- Manipulatives, visuals and Wiki Sticks to illustrate/define arrays
- Raised grid (to keep structure of array) or graph paper
- Highlighted text is present simple word problem
- Use PPT and shape tool to create arrays to match a provided problem
- Interactive whiteboard or other technology to create arrays
|
- Refer to Instructional Resource Guide for full descriptions and examples of systematic instructional strategies
| CCSS: N/A
|
| CCC:
|
K.PRF.2a3
|
Extend a repeating numerical AB pattern.
|
| Strand: Patterns, Relations and Functions
|
Family: Describing and Extending Patterns
|
| Progress Indicator: E.PRF.2a Recognizing, describing, and extending simple repeating (ABAB) and growing (A+1, A+2, A+3) patterns (e.g., colors, sounds, words, shapes, numeric – counting, odd, even)
|
| Essential Understandings
|
Concrete Understandings:
- Identify attribute (color, shape, size) of an object used in a pattern.
|
Representation:
- Recognize patterns and use words to describe the patterns they see.
- Use colors, shapes, symbols or objects to represent an AB pattern.
- Know the following vocabulary: pattern
|
Suggested Instructional Strategies:
- Multiple Exemplar Training or Example/Non-Example Training:*
- AB Pattern: "Here is a pattern (
 ). Here is the same pattern. Here is the same pattern. This not the same pattern. Show me a pattern that is the same as this pattern (point to the first pattern). ). Here is the same pattern. Here is the same pattern. This not the same pattern. Show me a pattern that is the same as this pattern (point to the first pattern).
- Teach explicitly how an AB pattern has the same pattern over and over and never changes using colors, shapes, or objects.
- Model-Lead-Test*
- Model an AB growing pattern using pictures, 2D shapes or 3D objects (e.g., "Watch me show a pattern…Let's make a pattern together… You try making a pattern.")
- Task Analysis (Backward Chaining)
- Provide an "AB" pattern. Add on to the pattern by adding "A" to the pattern. Ask the student to add the next element/what comes next ("B") in the pattern.
- Continue to extend the pattern.
|
Suggested Supports and Scaffolds:
- Examples of AB patterns in real-world setting (e.g., in the environment and art)
- Use of graphic organizers to illustrate an AB pattern in which the student places pictures, 2D or 3D shapes or colors
- Counters
- 2D and 3D shapes, objects, or pictures
- Interactive whiteboard or other technology to model AB patterns
- Use of graphic organizers to illustrate a pattern of sets in which the student places 2D or 3D shapes or colors showing an A B pattern

|
- Refer to Instructional Resource Guide for full descriptions and examples of systematic instructional strategies
| CCSS: 1.OA.1 Use addition and subtraction within 20 to solve word problems involving situations of adding to, taking from, putting together, taking apart, and comparing, with unknowns in all positions, e.g., by using objects, drawings, and equations with a symbol for the unknown number to represent the problem.
|
| CCC:
|
1.PRF.1b3
|
Using objects or pictures to respond appropriately to "add __" and "take away ___"
|
| Strand: Patterns, Relations and Functions
|
Family: Representing and Modeling Problems
|
| Progress Indicator: E.PRF.1b Exploring and describing how addition or subtraction changes a quantity
|
| Essential Understandings
|
Concrete Understandings:
- Show addition with objects to an existing set.
- Count objects.
- Make a set with objects or with drawings given a number.
|
Representation:
- Select a pictorial of a set that has been added or taken away from.
- Know the following symbols and vocabulary: =, +, - , take away, add.
|
Suggested Instructional Strategies:
- Teach explicitly the meaning of "add" and "take away" by connecting the vocabulary to known language (e.g. "add" means plus, more, join; "take away" means less, fewer);
- Teach/model "adding to" a set of object results in a larger set; teach "take away" from a set of objects results in a smaller set;
- Compare two sets of unequal number of objects and ask the student which set has been added to (larger set) OR which set has objects taken away (smaller set)
- Model-Lead-Test:*
- Model "adding to" and "taking away" use objects (e.g., "Watch me add to this group of objects. …Let's add to this group of objects together…You try adding to this group of objects. Good, this group is bigger because we added to it.").
- Indicate that the new group of objects is larger is adding to and smaller if taking away.
- Use counting strategies and modeling problem solving with supports.
|
Suggested Supports and Scaffolds:
- Counters (chips)
- Picture and objects
- Number line
- Graphic organizers
|
- Refer to Instructional Resource Guide for full descriptions and examples of systematic instructional strategies
| CCSS: N/A
|
| CCC:
|
1.PRF.2b2
|
Create a growing pattern using numbers or objects.
|
| Strand: Patterns, Relations and Functions
|
Family: Describing and Extending Patterns
|
| Progress Indicator: E.PRF.2b creating and explaining repeating and growing patterns using objects or numbers
|
| Essential Understandings
|
Concrete Understandings:
- Recognize/identify an AB pattern as a pattern that has the same pattern over and over and never changing using colors, shapes, or objects
- Count.
- Join objects to represent addition.
- Identify that a growing pattern increases by same amount.
|
Representation:
- Match a pattern using symbols or objects to represent a provided growing addition pattern.
|
Suggested Instructional Strategies:
- Multiple Exemplar Training or Example/Non-Example Training*
- Growing Pattern: "Here is a pattern that grows by 1 (
 ). Here is that pattern that grows by one ( ). Here is that pattern that grows by one ( ). Here is that pattern that grows by one ( ). Here is that pattern that grows by one ( ). This pattern does not grow by one ( ). This pattern does not grow by one ( ). Show me a pattern that grows by one. ). Show me a pattern that grows by one.
- Teach explicitly how a growing pattern increases/changes by the same number (+1 or +2) pattern using colors, shapes, or objects
- Teach/model a growing addition patterns using 2D shapes or 3D objects as a pattern that increases by the same number in each row of the pattern (e.g., a pattern that grows by +2 would have 1 in the first row, 3 in the second row, 5 in the third row, and 7 in the fourth row).
- Model-Lead-Test*
- Model making a growing pattern using objects (e.g., "Watch me add two to this pattern to make it grow by 2…Let's add two more objects to this pattern together to make it grow by two…You try adding two more object to this pattern to make it grow by two.).
- Task Analysis (Backward Chaining)
- Provide the first two rows of a growing addition pattern and ask the student to create the third row.
- Using a T-chart, provide the first two of the growing pattern and ask the student to create the third part of the pattern.
|
Suggested Supports and Scaffolds:
- Unit blocks of ones
- Colored tiles
- Counters
- Graphic organizer (tables with two columns)
- Colored 2D figures and 3D objects
- Examples of growing patterns in real-world settings (e.g., in the environment and art)
- T-Charts for growing patterns
- Use of graphic organizers to illustrate a pattern of sets in which the student places 2D or 3D shapes or colors using addition: e.g., +2 growing pattern:

- Interactive whiteboard or other technology to model growing patterns
|
- Refer to Instructional Resource Guide for full descriptions and examples of systematic instructional strategies
| CCSS: N/A
|
| CCC:
|
2.PRF.2c2
|
Identify the rule of arithmetic patterns that are increasing.
|
| Strand: Patterns, Relations and Functions
|
Family: Describing and Extending Patterns
|
| Progress Indicator: E.PRF.2c Extending and analyzing simple numeric patterns with rules that involve addition and subtraction
|
| Essential Understandings
|
Concrete Understandings:
- Recognize/identify a growing pattern with a single element (i.e., apple) that has one more member at each successive step using colors, shapes, or objects.
- Count.
- Join objects to represent addition.
|
Representation:
- Match a pattern using symbols or objects to represent a provided growing addition pattern.
- Recognize patterns and describe the patterns.
- Understand the following concepts and vocabulary: growing pattern, level, increasing/increases, objects or shapes.
|
Suggested Instructional Strategies:
- Multiple Exemplar Training or Example/Non-Example Training*
- Growing Pattern: "Here is a pattern that grows by two. Here is that pattern growing by two. Here is that pattern that is growing by two more. This pattern does not grow by two. Show me a pattern that grows by two."
- Teach explicitly how a growing pattern increases/changes by the same number (+1 or +2) pattern using colors, shapes, or objects.
- Teach/model a growing addition patterns using 2D shapes or 3D objects as a pattern that increases by the same number in each row of the pattern (e.g., a pattern that grows by +3 would have 1 in the first row, 4 in the second row, 7 in the third row)
- Model a growing pattern using a T-chart:

- Using a T-chart, provide the first two rows of the growing pattern and ask the student to create the third row of the growing pattern
- Model- Lead-Test
- Model making a growing pattern using objects (e.g., "Watch me add two to this pattern to make it grow by 2…Let's add two more objects to this pattern together to make it grow by two…You try adding two more object to this pattern to make it grow by two.). Ask, what number did we add each time? What is the rule for this growing pattern?
- Task Analysis (Backward Chaining)
- Provide the first two rows of a growing addition pattern and ask the student to create the third row.
- Ask students to determine if the rule for a growing pattern exists for a provided pattern OR to identify a rule for a growing pattern. (A pattern follows a predictable sequence (+1, +2, +3) OR There is no predictable sequence in this example, i.e., No rule can be stated.)
|
Suggested Supports and Scaffolds:
- Counters, shapes, and objects
- Examples of growing patterns in real-world settings (e.g., in the environment and art)
- Use of graphic organizers to illustrate a growing pattern in which the student places pictures, 2D or 3D shapes or colors
- 2D and 3D shapes, objects, or pictures
- Interactive whiteboard or other technology to model AB patterns
- Use of graphic organizers to illustrate a pattern of sets in which the student places 2D or 3D shapes or colors showing a growing pattern
|
- Refer to Instructional Resource Guide for full descriptions and examples of systematic instructional strategies
| CCSS: 2.OA.1 Use addition and subtraction within 100 to solve one and two-step word problems involving situations of adding to, taking from, putting together, taking apart, and comparing, with unknowns in all positions, e.g., by using drawings and equations with a symbol for the unknown number to represent the problem.
|
| CCC:
|
2.PRF.1c5
|
Write or select an equation representing the problem and its solution.
|
| Strand: Patterns, Relations and Functions
|
Family: Problem Solving and Using Variables
|
| Progress Indicator: E.PRF.1c Modeling problem solving situations that involve addition and subtraction of whole numbers using objects, diagrams, and symbols
|
| Essential Understandings
|
Concrete Understandings:
- Match the action of combining with vocabulary (i.e., in all; altogether) or the action of decomposing with vocabulary (i.e., have left; take away) in a word problem.
- Count up to __ objects.
|
Representation:
- Identify a representation of an array that matches the problem.
- State what the numbers represent.
- Understand the following concepts and vocabulary: adding to, take away, equation.
|
Suggested Instructional Strategies:
- Teach explicitly the meaning of "add" and "take away" by connecting the vocabulary to known language (e.g., "add" means plus, more, join; "take away" means less, fewer).
- Teach/model "adding to" a set of object results in a larger set; teach "take away" from a set of objects results in a smaller set; teach "adding" means joining and "take away" means removing.
- Compare two sets of unequal number of objects and ask the student which set has been added to (larger set) OR which set has objects taken away (smaller set).
- Model-Lead-Test:*
- Model "adding to" and "taking away" using objects (e.g., "Watch me add to this group of objects…Let's add to this group of objects together…You try adding to this group of objects.).
- Indicate that the new group of objects is larger if adding to and smaller if taking away.
- Teach explicitly how to create a group/row/set/array of objects for a given number or for a number provided in a simple word problem.
- Example / Nonexample*
- Present a row of objects (≤ 10). Present a second row of objects that has a different number of objects. Ask the student to select the row with a specified number of objects.
- Present three rows of objects (≤ 10), two that are equal and one that is not equal. Ask the student to match the two rows that both include the same number of specified objects (e.g., a row of three hats, a row of three hats, a row of 5 shoes).
- Present a simple word problem and a set of arrays to match specified numbers of objects in the problem. Ask the student to identify which array matches a specific number of objects.
- Task Analysis: Provide an equation for a simple addition or subtraction problem and have the student identify the numbers and a corresponding group of objects indicated in the problem (provide cards with numbers and sets of objects related to the problem).
- Present a simple subtraction problem (e.g., There are six eggs in the carton. The cook took away three eggs to make breakfast. How many eggs are left in the carton?).
- State a number of objects in the problem (e.g., six eggs).
- Show me the number six in the problem.
- Six tells how many what in the problem?
- Make a set of six eggs.
- Show me the number three in the problem.
- Three tells how many what in the problem?
- Take away three eggs from six eggs.
- How many eggs are left in the in the carton?
- Show me three in the equation.
- Task Analysis: Provide an equation template for a simple addition or subtraction problem and have the student identify the numbers and a corresponding group of objects indicated in the problem to complete the equation on the template.
- Task Analysis: Use two rows of pictures or objects to model a one step addition and subtraction problem.
- Present a simple one step addition problem and sets of objects (e.g., Three girls are in the choir. Five boys are in the choir. How many girls and boys are there altogether in the choir?).
- Here is a group/array of three girls. Here is a group/array of five girls. Show me the array that matches the number of girls in the problem.
- Here is a group/array of five boys. Here is a group/array of two boys. Show me the array that matches the number of boys in the problem.
- Provide two problem solving templates with corresponding arrays (let the student manipulate the objects to test out the solutions):
- Here is a group/array of six girls and boys. ___ ___ ___ ___ + ___ ___ = ___ ___ ___ ___ ___ ___
- Here is a group/array of eight girls and boys: ___ ___ ___ + ___ ___ ___ ___ ___ = ___ ___ ___ ___ ___ ___ ___ ___
- Show me the array that matches how many girls and boys are in the choir.
- Provide two or three equations and ask the student to match the equation to a presented simple word problem.
|
Suggested Supports and Scaffolds:
- Pictures and manipulatives
- Template for solving an equation
- Number line
- Calculator
|
- Refer to Instructional Resource Guide for full descriptions and examples of systematic instructional strategies
| CCSS: 3.OA.9 Identify arithmetic patterns (including patterns in the addition table or multiplication table), and explain them using properties of operations. For example, observe that 4 times a number is always even, and explain why 4 times a number can be decomposed into two equal addends.
|
| CCC:
|
3.PRF.2d1
|
Identify multiplication patterns in a real-word setting.
|
| Strand: Patterns, Relations, and Functions
|
Family: Describing and Extending Patterns
|
| Progress Indicator: E.PRF.2d Representing and analyzing patterns and rules (e.g. doubling, adding 3) using words, tables, graphs, and models
|
| Essential Understandings
|
Concrete Understandings:
- Identify that a pattern is formed by repeatedly adding the same number to a set.
- Add within 100 with calculator and/or manipulatives.
|
Representation:
- Match a pattern using symbols or objects to represent a provided growing multiplication pattern in a real-word setting.
- Recognize patterns and use words to describe the patterns they see.
- Understand the following concepts and vocabulary: growing pattern, multiplication, level, increasing/increases, decreasing/decreases, objects or shapes
|
Suggested Instructional Strategies:
- Multiple Exemplar Training or Example/Non-Example Training*
- Growing Pattern: "Here is a growing pattern. Here is a growing pattern. Here is growing pattern. This not a growing pattern. Show me a growing pattern."
- Ask students to determine if a rule exists for a provided pattern. (A pattern follows a predictable sequence OR There is no predictable sequence in this example, i.e., no rule can be stated.)
- Model-Lead-Test*
- Teach/model growing addition patterns using 2D shapes or 3D objects as a pattern that increases by the same number in each row of the pattern (e.g., a pattern that grows by +2 would have 1 in the first row, 3 in the second row, 5 in the third row, and 7 in the fourth row).
- Teach/model a growing multiplication problem using pictures (1 flower, 2 bees; 2 flowers, 4 bees; 3 flowers, 6 bees).
- Task Analysis (Backward Chaining)
- Provide the first three rows of a growing addition pattern and ask the student to create the fourth row.
- Using a T-chart, provide the first three parts of the growing pattern and ask the student to create the fourth part of the pattern.
|
Suggested Supports and Scaffolds:
- Examples of repeating patterns in a real-world setting (e.g., in the environment and art)
- T-Charts for growing patterns
- Use of graphic organizers to illustrate a pattern of sets in which the student places 2D or 3D shapes or colors using addition or multiplication (e.g., +3 growing pattern)

- Counters
- 2D and 3D shapes, objects, or pictures
- Interactive whiteboard or other technology to model growing patterns
|
- Refer to Instructional Resource Guide for full descriptions and examples of systematic instructional strategies
| CCSS: 3.OA.1 Interpret products of whole numbers, e.g., interpret 5 × 7 as the total number of objects in 5 groups of 7 objects each. For example, describe a context in which a total number of objects can be expressed as 5 × 7.
|
| CCC:
|
4.PRF.1d2
|
Use objects to model multiplication and division situations involving up to 10 groups with up to 5 objects in each group and interpret the results.
|
| Strand: Patterns, Relations and Functions
|
Family: Representing and Modeling Problems
|
| Progress Indicator: E.PRF.1d Describing and modeling how addition, subtraction, multiplication, or division changes a quantity, including with fractions
|
| Essential Understandings
|
Concrete Understandings:
- Create an array (e.g., show me 2 groups/rows of 3; or 2X3).
- Use calculator and/or manipulatives to add and subtract within 50.
|
Representation:
- Use an array to represent a multiplication or division problem.
- Select a numeral to place under each representation in the modeled equation.
- Select a pictorial representation of an array that matches the multiplication or division problem.
- Understand the following concepts, vocabulary and symbols: =, X, ÷ , groups, objects, set, equal groups, combination, comparison, multiplication, division, array, row, column, equation.
|
Suggested Instructional Strategies:
- Multiple Exemplar Training*
- Equal sets: "This is a set. This is an equal set. This is an equal set. This is not an equal set. Show me an equal set."
- Teach multiple ways of describing multiplication (e.g., 2 x 2 = 4; 2 times 2 = 4; a 2 by 2 array is 4).
- Task Analysis for solving simple multiplication and division problems using arrays:
- When multiplying, teach that "X" means multiply and to read the multiplication symbol as "rows of." For example, read the problem 2 x 3 as "two rows of three."
- Teach that the first number indicates the number of rows and the second number indicates the number of shapes/objects in each row.
- Using grid paper or other graphic organizer, draw the first row of the array (e.g., one row of three).
- Draw the second row of the array (e.g., second row of three).
- Count the symbols, shapes, pictures, or objects in both rows to solve.
- To interpret the results, state the answer (total number of symbols, shapes, pictures, or objects).
- When dividing, solve the problem using arrays. For example, solve 20 ÷ 4:
- Create a set of 20 shapes/objects based on the first number (the dividend).
- Divide/separate the set into 4 equal sets (given the second number (4) in the division problem).
- Count the number of equal sets to solve the problem.
- Use arrays to model multiplication and division problems.
- Show (2 X 3): two (number of groups/rows) times three (counters in each group); using a rectangle, the height is the number of rows and the base is the number of units in each row:


- Trial and error to form equal sets of objects to make the arrays
- Multiple exemplars for equal and not equal*
- Model-Lead-Test*
|
Suggested Supports and Scaffolds:
- Counters
- Number lines
- Egg cartons or muffin tins to illustrate/create arrays
- Ones and tens blocks to form different rectangles (rows and columns)
- Manipulatives, visuals, and Wiki Sticks to illustrate/define arrays
- T-chart with two columns showing the multiplier in the first column and the number of units in the second column to represent a growing pattern
- Raised grid (to keep structure of array) or graph paper
- Use PPT and shape tool to create arrays to match a provided problem
- Interactive whiteboard or other technology to create arrays
|
- Refer to Instructional Resource Guide for full descriptions and examples of systematic instructional strategies
CCSS: 5.NF.5 Interpret multiplication as scaling (resizing), by:
- a Comparing the size of a product to the size of one factor on the basis of the size of the other factor, without performing the indicated multiplication.
Explaining why multiplying a given number by a fraction greater than 1 results in a product greater than the given number (recognizing multiplication by whole numbers greater than 1 as a familiar case); explaining why multiplying a given number by a fraction less than 1 results in a product smaller than the given number; and relating the principle of fraction equivalence a/b = (n × a)/(n × b) to the effect of multiplying a/b by 1.
|
| CCC:
|
5.PRF.1a1
|
Determine whether the product will increase or decrease based on the multiplier.
|
| Strand: Patterns, Relations and Functions
|
Family: Proportional Relationships and Graphing
|
| Progress Indicator: M.PRF.1a Describing how multiplication or division changes a quantity, including with fractions or decimals
|
| Essential Understandings
|
Concrete Understandings:
- Show what happens to a set when it's multiplied by 1(1X) or some other whole number (2X).
- Example: I have 3 chips; which is one set of 3 chips…Now show me 2 sets of 3 chips. …Which is more?
- Use whole numbers.
|
Representation:
- Select a pictorial representation that matches the multiplication problem.
- Recognize that when a number is multiplied by a fraction or decimal, the product will decrease.
- Recognize that when a number is multiplied by a number greater than one, the product will increase.
- Know the following vocabulary and symbols: =, X, >, <, proportion, product, multiplier, factor.
|
Suggested Instructional Strategies:
- Explicitly teach that a multiplicand multiplied by a whole number multiplier increases the product and a fraction/decimal multiplier decreases the product; demonstrate a strategy for self-checking the answer.
- Task analysis example:
- State the problem using a whole number multiplier.
- Predict if the product will increase or decrease.
- Show me one set of (X) chips. Count the chips. How many?
- Now show me 2 sets of (X) chips. Count the chips. How many?
- State the total number of chips.
- Student states if the product is greater or less than the multiplicand.
- Task analysis example:
- State the problem using a fraction multiplier.
- Predict if the product will increase or decrease.
- Provide a set of total number of chips to be divided by a fraction.
- Model the number of created sets.
- Student states if the product is greater or less than the multiplicand.
- Use counting strategies.
- Use number patterns (i.e., skip counting).
- Modeling problem solving with supports.
- Show multiplication as repeated addition (write 3 X 3 as 3 + 3 + 3).
|
Suggested Supports and Scaffolds:
- Counters (chips)
- Picture and objects
- Number line
- Fraction strips and tables
- Decimal tables
- Multiplication table or calculator to self-check answers
- Graphic organizers (rows and columns)
|
| CCSS: 6.EE.7 Solve real‐world and mathematical problems by writing and solving equations of the form x + p = q and px = q for cases in which p, q and x are all nonnegative rational numbers.
|
| CCC:
|
6.PRF.1d1
|
Solve real-world single step linear equations.
|
| Strand: Patterns, Relationships and Functions
|
Family: Problem Solving and Using Variables
|
| Progress Indicator: M.PRF.1d Using symbolic equations to summarize how the quantity of something changes
|
| Essential Understandings
|
Concrete Understandings:
- Use objects to solve one-step addition and subtraction equations with whole numbers.
|
Representation:
- Match a representation of an equation with a variable to a real-world problem.
- Set up an equation in which both sides are equal (adding or subtracting the same number/value from both sides of the equation).
- Understand the following vocabulary and symbols: +, -, X, ÷, =
- Understand the following concepts and vocabulary: variable, solution, equation
|
Suggested Instructional Strategies:
- Explicitly teach strategies for determining the operation required to solve a single step real-world problem.
- Task analysis
- Read the story problem.
- Identify what question is being asked (define "x").
- Identify the facts and the operation (+, - , x, ÷) in the story to write an equation.
- Add or subtract the value number/value from both sides of the equation.
- Solve the equation for "x".
- Show the answer as "x" = ___.
- Adding and subtracting strategies
|
Suggested Supports and Scaffolds:
- Pictures and manipulatives
- Template for solving an equation
- Number line
- Calculator
|
| CCSS: 6.RP.1 Understand the concept of a ratio and use ratio language to describe a ratio relationship between two quantities. For example, "The ratio of wings to beaks in the bird house at the zoo was 2:1, because for every 2 wings there was 1 beak." "For every vote candidate A received, candidate C received nearly three votes."
|
| CCC:
|
6.PRF.1c1
|
Describe the ratio relationship between two quantities for a given situation.
|
| Strand: Patterns, Relationships and Functions
|
Family: Proportional Relationships and Graphing
|
| Progress Indicator: M.PRF.1c Comparing two rates and evaluating them for a given situation (e.g., best value)
|
| Essential Understandings
|
Concrete Understandings:
- Match/identify a simple ratio (1:X) as the relationship between two quantities.
- Given a situation use objects or a calculator to set up a ratio.
|
Representation:
- Recognize the meaning of the placement of numbers in a ratio for a given situation.
- Show a ratio in three ways: number to number (1 to 2) expressed as a fraction (1/2) or using a colon 1:2.
- Represent the ratio of objects (e.g., red hats) to the total number of objects (red and green hats) (part-to-whole).
- Represent the ratio of the number of one object (red hats) to the number of other objects (green hats) from a set of objects (red and green hats) (part-to-part).
- Understand the following concepts and vocabulary: ratio, rate, proportion, prices, portions per person.
|
Suggested Instructional Strategies:
- Multiple Exemplar Training:*
- Example for equal sets: "This is a proportional relationship. This is a proportional relationship. This is a proportional relationship. This is not a proportional relationship. Show me a proportional relationship."
- Example for representing ratios: There are three chairs for one/each table. The ratio is 3 to 1. The ratio is 3:1. The ratio is 3/1. The ratio is not 1 to 3. Show me the ratio for three chairs for one table.
- Explicit teaching of three ways to represent a ratio
- Task Analysis example:
- Read the story problem/situation: "In one (1) day, Jack reads two (2) books. How many books will Jack read in 4 days?
- Use the information to fill in a table. Find the word/picture that follows the number. Write the first word/picture in the first row/ column (point to the row/column).
- Write the second word/picture in the second row/first column (point to the row/column).
- Use the information in the problem/situation to fill in the number of days.
- Use the information in the problem/situation to fill in the number of books.
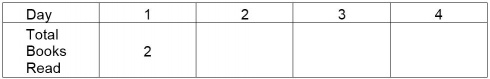
- Here is a way to show the ratio / compare the two numbers: (___: ___)
- Put the numbers of days here. Put the number of books here.
- You showed the ratio of days to books. Show/tell me the ratio.
- Teach what" twice as many" (2 times the original) or "three times as many" (3 times the original) means.
- Multiple Exemplar Training example:\*
- Ratio: Here is the ratio 3: 1. This picture shows the ratio.

- This picture shows the ratio.
- This does not show the ratio.

- Show me a picture that shows the ratio 3:1.
- Provide a ratio and ask the student to use unit blocks to show the ratio (e.g., the ratio of girls to boys in our class is 3:2. Use the unit blocks to show the ratio of girls to boys.).
- Provide unit blocks showing a ratio and ask the student to define the proportional relationship/rule.
- Provide a ratio based on standard measurement and ask the student to complete a table for increasing quantities (e.g., 1 foot = 12 inches; 3 feet = 1 yard; 1 dime = 2 nickels or four quarters = one dollar).
|
Suggested Supports and Scaffolds:
- Unit blocks of ones
- Colored tiles
- Graphic organizer (tables with two columns)
- Grid paper or raised grid paper
- Colored 2D figures and 3D objects
- Interactive whiteboard or other technology to manipulate representations of ratios
|
- Refer to Instructional Resource Guide for full descriptions and examples of systematic instructional strategies
CCSS: 7.EE.4 Use variables to represent quantities in a real‐world or mathematical problem, and construct simple equations and inequalities to solve problems by reasoning about the quantities.
- Solve word problems leading to equations of the form px + q = r and p(x + q) = r, where p, q, and r are specific rational numbers. Solve equations of these forms fluently. Compare an algebraic solution to an arithmetic solution, identifying the sequence of the operations used in each approach. For example, the perimeter of a rectangle is 54 cm. Its length is 6 cm. What is its width?
- Solve word problems leading to inequalities of the form px + q > r or px + q < r, where p, q, and r are specific rational numbers. Graph the solution set of the inequality and interpret it in the context of the problem. For example: As a salesperson, you are paid $50 per week plus $3 per sale. This week you want your pay to be at least $100. Write an inequality for the number of sales you need to make, and describe the solutions.
|
| CCC:
|
7.PRF.1g2
|
Use variables to represent quantities in a real‐world or mathematical problem, and construct simple equations and inequalities to solve problems by reasoning about the quantities
|
| Strand: Patterns, Relationships and Functions
|
Family: Problem Solving and Using Variables
|
| Progress Indicator: M.PRF.1g Modeling, solving, and explaining contextualized problems using various representations such as graphs, tables, functions, and equations
|
| Essential Understandings
|
Concrete Understandings:
- Identify situation in which quantities are equal or unequal.
- Record/replace a variable in an equation with a fact from a story on a graphic organizer.
|
Representation:
- Create a pictorial array of a simple equation to translate wording.
- Understand the following concepts, vocabulary, and symbols: +, -, X, ÷, =, ≠, <, >, equation, equal, inequality
|
Suggested Instructional Strategies:
- Explicitly teach equality vs. inequality.
- Explicitly teach strategies for determining the operation required to solve a single step real-world problem.
- Task analysis
- Read a story problem that is personally relevant to the student.
- Identify what question is being asked (define "x").
- Identify the facts and the operation (+, - x, ÷) in the story.
- Provide graphic organizer or template to organize the facts and write.
- Write an equation to solve for "x."
- Add, subtract, multiply or divide the number/value to both sides of the equation.
- Solve the equation for "x"
- Show the answer as "x" = ___.
- Explicit teaching of how to identify what question is being asked (i.e., what" x" represents in the story problem).
- Provide an equation for which the student will determine a story problem.
- Create a personally relevant story; provide graphic organizers as a means for organizing student's work; task analytic instruction to break down skills and chain them in order to isolate each step in solving the math task.
- Adding and subtracting strategies
- Multiplying and dividing strategies
|
Suggested Supports and Scaffolds:
- Counters
- Number lines
- Multiplication tables
- Calculator
- Interactive whiteboard
|
| CCSS: 7.RP.3 Use proportional relationships to solve multistep ratio and percent problems. Examples: simple interest, tax, markups and markdowns, gratuities and commissions, fees, percent increase and decrease, percent error
|
| CCC:
|
7.PRF.1f1
|
Use proportional relationships to solve multistep percent problems.
|
| Strand: Patterns, Relationships and Functions
|
Family: Proportional Relationships and Graphing
|
| Progress Indicator: M.PRF.1f Identifying essential quantitative relationships in a situation and using symbolic expressions to represent it and draw reasonable conclusions from it
|
| Essential Understandings
|
Concrete Understandings:
- Identify how one variable changes in relation to another variable in a directly proportional relationship.
- a/b = c/d If a increases, what will happen to c?
- Apply understanding to convert percents to decimals.
|
Representation:
- Use a proportion method to solve (part/whole = number/100).
- Set up a proportion to solve for an unknown value.
- Follow a sequence of steps to solve a problem.
- Understand the following vocabulary and symbol: % (percent), proportion.
|
Suggested Instructional Strategies:
- Task Analysis example: Read the story problem/situation: If 3 out of 5 animals are dogs, what percent of the animals is made up of dogs?
- Fill in the proportion using the provided information in the story problem to record what is known and what is unknown/represented by "x" (what to solve for).
- Say, "In this problem, you are being asked 3 is what percent of 5. You are given two numbers (3 and 5) and asked to find the third (X) in this problem."
- The 3 is the part. Write 3 in the proportion.
- The 5 is the whole. Write 5 in the proportion.
- The percent is unknown or x. Write x in the proportion.
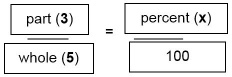
- Fill in the numbers on each side.

- Use the calculator to multiply the numbers on each side of the equation.
- Use the calculator to divide each side of the equation by 5.
- What percent is X? Write that number (3 is ___% of 5).
- Explicit instruction on using ratio tables to find a percent of a quantity
- Explicit instruction on cross multiplying
- Explicit instruction on solving for X (dividing both sides)
|
Suggested Supports and Scaffolds:
- Highlight text that provides important information/vocabulary
- Counters
- Multiplication table
- Calculator
- Table showing fractions and percentages (3/5 = 60%)
- Graphic organizers
- Interactive whiteboard or other technology to manipulate representations
|
CCSS: 8.EE.7 Solve linear equations in one variable.
- Give examples of linear equations in one variable with one solution, infinitely many solutions, or no solutions. Show which of these possibilities is the case by successively transforming the given equation into simpler forms, until an equivalent equation of the form x = a, a = a, or a = b results (where a and b are different b). Solve linear equations with rational number coefficients, including equations whose solutions require expanding expressions using the distributive property and collecting like terms.
|
| CCC:
|
8.PRF.1g3
|
Solve linear equations with 1 variable.
|
| Strand: Patterns, Relationships and Functions
|
Family: Problem Solving and Using Variables
|
| Progress Indicator: M.PRF.1g Modeling, solving, and explaining contextualized problems using various representations such as graphs, tables, functions, and equations
|
| Essential Understandings
|
Concrete Understandings:
- Use manipulatives or graphic organizer to solve a problem.
- Identify the reciprocal operation in order to solve one step equations.
|
Representation:
- Create a pictorial array of a simple equation to translate wording to solve for x or y.
- Understand the following concepts, vocabulary, and symbols: +, -, X, ÷, =, variable, equation.
|
Suggested Instructional Strategies:
- Explicit strategy: Solve an equation by dividing both sides of the equation by the value in front of the variable and then simplify.
- Use trial and error to determine the value of x or y. (Is the product too low, too high?)
- Use arrays (e.g., 3y = 12; When you have a total of 12 counters divided into three equal sets, how many tokens are in each set (= "y")?).
- Task analysis
- Read the story problem.
- Identify what question is being asked / what x represents (define "x").
- Identify the facts and the operation (+, - x, ÷) in a story to write an equation.
- Solve the equation for "x."
- Show the answer as "x" = ___.
|
Suggested Supports and Scaffolds:
- Counters
- Grids or graphic organizers to create arrays
- Multiplication chart
- Calculator
- Interactive whiteboard
|
| CCSS: 8.EE.5 Graph proportional relationships, interpreting the unit rate as the slope of the graph. Compare two different proportional relationships represented in different ways. For example, compare a distance‐time graph to a distance‐time equation to determine which
of two moving objects has greater speed.
|
| CCC:
|
8.PRF.1e2
|
Represent proportional relationships on a line graph.
|
| Strand: Patterns, Relationships and Functions
|
Family: Proportional Relationships and Graphing
|
| Progress Indicator: M .PRF.1e Representing and computing unit rates associated with ratios of lengths, areas, and other quantities measured in like or different units
|
| Essential Understandings
|
Concrete Understandings:
- Identify parts of a line graph.
- Identify the 2 coordinates of a point on a line graph.
- Examine the values of the x variable or y variable to look for a pattern.
- Recognize a positive relationship between two variables.
|
Representation:
- Graph a series of coordinates on a graph.
- Identify given coordinates (x,y) as a point on a graph.
- Identify the intercept(s) on a graph.
- Understand the following concepts, vocabulary, and symbols: coordinates, ordered pairs(x,y), intercept, grid, axis, point, proportion, line, slope.
|
Suggested Instructional Strategies:
- Teach explicitly that a coordinate grid has two perpendicular lines, or axes, labeled like number lines.
- Teach explicitly how to recognize the relationship between y and x using the coordinates of several points (e.g., y increases as x increases; the ratio is the same for all values if they are directly proportional).
- Provide multiple examples of line graphs with different, labeled coordinates and slopes.
- Teach explicitly how to plot coordinates on a grid and draw the line.
- Teach explicitly how to define a line provided on a grid by multiple coordinates.
- Teach explicitly simple distance/time problems that illustrate how the rates of two objects can be represented, analyzed and described graphically.
- Task Analysis
- Provide a series of proportional coordinates.
- Present a labeled graph.
- Identify the x coordinate and y coordinate and plot each point.
- List coordinates on a "T" chart, (x in one column and y in the other) for each set of coordinates.
- State the proportional relations;_ : _
|
Suggested Supports and Scaffolds:
- Grid paper with raised perpendicular lines (horizontal and vertical lines) and points
- Models
- T-chart, graphic organizer
- Rulers, straightedge
- Calculator
|
| CCSS: 8.F.4 Construct a function to model a linear relationship between two quantities. Determine the rate of change and initial value of the function from a description of a relationship or from two (x, y) values, including reading these from a table or from a graph. Interpret the rate of change and initial value of a linear function in terms of the situation it models, and in terms of its graph or a table of values.
|
| CCC:
|
8.PRF.2e2
|
Identify the rate of change (slope) and initial value (y-intercept) from graphs.
|
| Strand: Patterns, Relationships and Functions
|
Family: Proportional Relationships and Graphing
|
| Progress Indicator: M.PRF.2e Using functions to describe quantitative relationships
|
| Essential Understandings
|
Concrete Understandings:
- Indicate the point on a line that crosses the y-axis.
- Describe the rate of change qualitatively (e.g., steep = rapid change).
|
Representation:
- Interpret/define a line graph with coordinates for multiple points.
- Identify coordinates (points) on a graph.
- Understand the following concepts and vocabulary: x axis, y axis, x intercept, y intercept, line, rise, fall, slope, rate of change.
|
Suggested Instructional Strategies:
- Explicitly teach axes (x-axis is the horizontal axis and the y-axis is the vertical axis) and coordinates for points.
- Explicitly teach identifying x,y coordinates for points on a graph.
- Explicitly teach counting distances between points on each axis.
- Explicitly teach that when x = 0, you are on the y-axis (the y-intercept); the initial value is the "starting point" where the line only passes through the y-axis once.
- Models of lines graphs (positive: rises from left to right; negative: falls from left to right; and coordinates of varying slope; match coordinates to graphs)
- Task analysis for rate of change/slope:
- Present a line graph showing the unit rate as the slope for a series of proportional coordinates.
- Present a formula template: slope = rise/run.
- Teach that the steepness, or slant, of a line is called the slope (e.g., a steep mountain).
- Identify two points on the line.
- Label the p points 1 and 2.
- Using two different colored pencils, mark the rise(red) and run (blue).
- Count the rise. (How many units do you count up (positive) or down (negative) to get from one point to the next? Record this number (change in value) as your numerator.)
- Count the run. (How many units do you count left (down/negative) or right to get to the point? Record this number (change in value) as your denominator.)
- Simplify the fraction if possible.
- Give students opportunities to gather their own data or graphs in familiar contexts.
- Task Analysis for initial value (y-intercept)
- Provide a template for recording the y-intercept: y-intercept/starting point = (0, (y))
- Find the y-axis.
- Highlight the y-axis.
- Look at the graph and identify and circle the point at which the line passes through the y-axis.
- Fill in the value of y in the template.
|
Suggested Supports and Scaffolds:
- Grid paper with raised perpendicular lines (horizontal and vertical lines) and points
- Models
- T-chart, graphic organizer
- Rulers, straightedge
- Colored pencils/markers
- Interactive white board
|
| CCSS: A.CED.1 Create equations and inequalities in one variable and use them to solve problems. Include equations arising from linear and quadratic functions, and simple rational and exponential functions.
|
| CCC:
|
H.PRF.2b1
|
Translate a real-world problem into a one variable linear equation.
|
| Strand: Patterns, Relationships and Functions
|
Family: Problem Solving and Using Variables
|
| Progress Indicator: H.PRF.2b Creating equations and inequalities (in one or two variables) and using them to solve problems and graph solutions
|
| Essential Understandings
|
Concrete Understandings:
- Match an equation with one variable to a real-world context.
|
Representation:
- Create a pictorial array of a simple equation to translate wording.
- Know the following vocabulary and symbols: +, -, X, ÷, =, linear, variable.
|
Suggested Instructional Strategies:
- Task analysis
- Present the story problem based on a real-world, relevant context and provide a template for recording facts/operation to solve the real-world problem.
- Highlight key information in the problem; strike through irrelevant information.
- Identify what question is being asked (define x).
- Identify the facts.
- Fill in the facts in the order presented in the story problem on the template.
- Determine the operation(s) (+, - X, ÷).
- Identify what operation should be completed first.
- Fill in the operation.
- State the equation.
- Solve for x.
- Answer the problem statement.
|
Suggested Supports and Scaffolds:
- Counters
- Multiplication chart
- Calculator
|
| CCSS: F.LE.1 Distinguish between situations that can be modeled with linear functions and with exponential functions.
|
| CCC:
|
H.PRF.1c1
|
Select the appropriate graphical representation of a linear model based on real-world events.
|
| Strand: Patterns, Relationships and Functions
|
Family: Proportional Relationships and Graphing
|
| Progress Indicator:'' H.PRF.1c Creating mathematical models, using rules and relationships to describe and predict objects and events in the real world ''
|
| Essential Understandings
|
Concrete Understandings:
- Match a point on a line as being part of a data set for a given line.
- Determine if a point is or is not on a line.
|
Representation:
- Identify coordinates (points) on a graph and in a data table.
- Select a graph that represents a simple linear equation.
- Match or plot the points from a data table on a graph.
- Understand the following concepts and vocabulary: x axis, y axis, x intercept, y intercept, line, slope.
|
Suggested Instructional Strategies:
- Model lines, graphs, and coordinates of varying slopes; match coordinates to graphs.
- Explicitly teach the relationship between positive slope and a line that slopes up left to right and negative slope and a line that goes down left to right.
- Task analysis:
- Present a story problem and a simple equation (e.g., y = 5x).
- Create a formula template and substitute x for at least three values to determine y.
- Create a table (T-chart) listing coordinates (x,y).
- Plot points on a coordinate grid; connect the points.
- Identify the coordinates on the line graph.
- Reverse the steps and begin with a line graph; identify the coordinates of at least three points, create a table listing the x and y coordinates; write a simple linear equation to represent the line graph.
|
Suggested Supports and Scaffolds:
- Grid paper with raised perpendicular lines (horizontal and vertical lines) and points
- Models
- T-chart, graphic organizer
- Rulers, straightedge
- Graphing calculator
- Interactive white board
|


